Partnership Announcements
NLT Deploys Esri Enterprise Using Everything-as-Code (EaC) Automation Model
Learn about NLT's automated deployment patterns for the Esri ArcGIS Server Enterprise 10.7 platform.
Discover the economic impact of hurricanes through NLT's Summer Research Internship project.
By Dana Kozhakhmetova, NLT Summer Intern
How long does it take to recover from a hurricane?
This was the main research question we were tasked to answer during a ten-week research internship at New Light Technologies. I have previously held research assistant positions at a university, but having the opportunity to work as one with the company was a completely different experience than I’ve ever encountered before. For the first time, I was no longer just an executor of given tasks, but a rightful member of a team. I was able to participate in all discussions about the research, methodologies, data collection, and then ultimately present my research and findings. Moreover, the company not only encouraged – but expected – that interns share their work results with the world community of scientists, researchers and policy makers. For my team and me, this opportunity might be the upcoming Fall Meeting of the American Geophysical Union in Washington, D.C.
Our first task was to define what “economic recovery” actually looked like and to develop the processes we would use to track it before we could answer our question. We debated between multiple variables. Is it gross domestic product (GDP) of a region? Is it the employment rate? Is it the brightness of nighttime lights captured by satellites? Where does policy fit in, and how do we even measure it? After intensive discussion with the team we decided to focus on nighttime lights and employment data. The combination of the two felt a suitable proxy measurements for the amount of economic activity present in a region before and after a hurricane hits.
Our first important task was to design and build a geodatabase that would store all the data we would collect. The design of the geodatabase is a first and crucial aspect of the research which many researchers deal with, because that’s when we determine what data to collect and when to stop. It’s an important step in facilitating efficient analysis and maintenance. It was very tempting to collect as much data as possible from the start, but we had to be cognizant about the constraints we faced on both our time and resources. Rather than doing it all at once, my team found it would much more efficient to use a slower process and to thoughtfully proceed with one thing at a time.
We settled on using a Visible Infrared Imaging Radiometer Suite (VIIRS) to collect Nighttime Day/Night Band (DNB) Composites. We used these to quantify and map the amount of light reflected at night, allowing more sensitivity compared to other lower resolution datasets available for analysis. This data was accessed through Google Earth Engine (GEE), which allowed us to not only interact with the data, but to also analyze it. The first challenge was to extract data in a certain way that will allow us to aggregate it to the level of the unit of analysis (the census block). We researched the literature to find the most efficient method, and found that, although GEE stores a lot of data, we needed to extract it in a certain way, not just simply download it. For this we had to come up with a code. The code had to calculate the sum of night time light per a unit of analysis and store it back in a table, together with a unique identifier.
But just converting and extracting data was not enough. Much work still needs to be done! Once the data was stored in a proper format, processed and projected, we found that, in many cases, it looked different from what we expected — some things just came off as outright bizarre. A researcher needs to logically think through her dataset, and to not simply trust it blindly. My team had to take a moment to step back and contemplate the nature of data, to think about the story behind it and why there would be a mismatch in our expectations vs what we found.
For example, on the image below (Graph 1) we mapped the nighttime light data as captured in February 2018. We attempted to show only non-zero values (i.e. we made all zero-value pixels transparent). Theoretically, nighttime lights are visible in places where there are urban markets. We found, however, that there are many zero values which could not be explained by a lack of economic activity. In cases like this, something else had to be going on. To find out what, we used an additional band of the VIIRS dataset we hadn’t considered before. We quickly understood that we must adjust for cloud coverage to ensure the quality of the data and its use in further analysis, as the band consisted of only cloud-free observations.
Our ten-week tenure offered a fully immersive experience in conducting every component of real-world research. We learned a lot in the process of collecting data and collaborating as a team and were ultimately able to produce something we all were proud of, shown below. The maps in Figure 1 are the final result of our analysis, which we present to the team as base for further and deeper analysis. As we can see, the effects of hurricanes are lagged, and the nature of hurricane is not simple and requires further investigation. The discussion about goals and methodology is a complicated and constantly evolving one, so, while we have concluded this portion of our research, it is by no means a conclusion of the research as a whole.
It might be frustrating that things don’t work out as originally planned, but you have to be flexible and go with the flow. The most important lesson I learned working with New Light Technologies was that research is an ever-changing process requiring constant adjustments, and teamwork is the most valuable tool in a researcher’s toolbox. Not only are your team members a resource with immense knowledge, they are also your biggest cheerleaders. A good team will never leave you on your own, and I was lucky to have found a good team during my time with New Light Technologies.
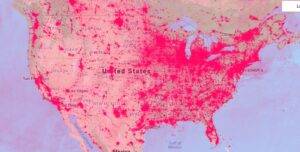
(Graph 1)
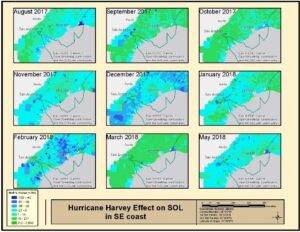
(Figure 1)
Learn about NLT's automated deployment patterns for the Esri ArcGIS Server Enterprise 10.7 platform.
Learn about the latest in AICF and serverless computing for GIS in the browser in NLT's webinar series update.