Data Science & Integration
FIFTY YEARS OF NIGHTLY GLOBAL LOW-LIGHT IMAGING SATELLITE OBSERVATIONS
Discover the profound impact of Nighttime Light Emission on urban life and well-being.
Explore the World Bank's Light Every Night data, offering insights into human civilization via nighttime lights imagery for global trend analysis.

Blog post authored by Daynan Crull
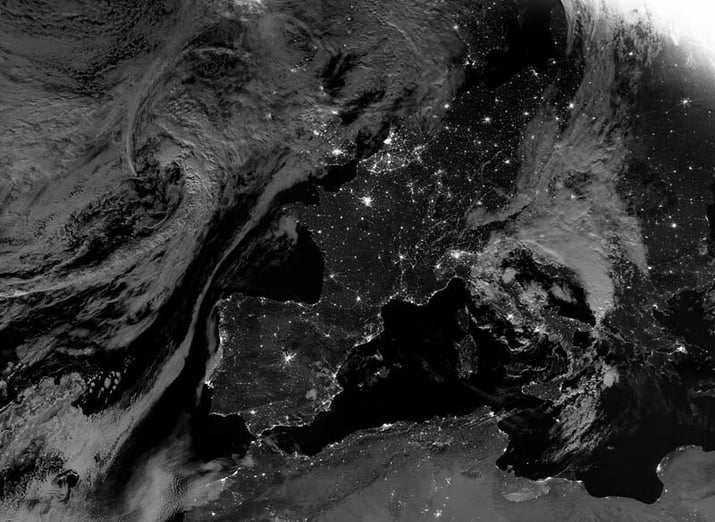
A view of Western Europe on the evening of August 5, 2020 as captured by the Suomi-NPP VIIRS-DNB sensor. Photo credit: Joshua Stevens ℅ the NASA Earth Observatory.
A clear photograph of the Earth at night is quite remarkable on the face of it. More profound, still, is the realization that these points of light yield insights into the activities of human civilization unfolding below. Researchers have been exploring these insights for decades. First they did so through the use of the U.S. Defense Meteorological Satellite Program Operational Linescan System (DMSP-OLS), and more recently through the Suomi-NPP Visible Infrared Imaging Radiometer Suite Day/Night Band (VIIRS-DNB).
Nighttime lights data provided by these satellites have opened entire avenues of research because of their global coverage and sensitivity to temporal dynamics. Examples include new research into economic activity (Donaldson & Storeygard, 2016; Henderson et al, 2018), socioeconomic trends (Proville et al, 2017), natural disasters (Qiang et al, 2020), impact evaluation and even the impacts of COVID-19 (Beyer et al, 2020; Elvidge et al, 2020). Unfortunately, although these data are collected daily, they’ve mostly been available only through composites representing aggregations of a month or a year.
Now, for the first time, an entire archive of data from both the DMSP-OLS (1992-2017) and VIIRS-DNB (2012-present) systems are available for every night. The collection spans three decades. New Light Technologies (NLT) is proud to assist this project and help with technical guidance for accessing and analyzing these data.
The World Bank Group, in partnership with the University of Michigan, the National Oceanic and Atmospheric Administration (NOAA) and with support of NLT has launched the World Bank – Light Every Night archive. The Light Every Night dataset is published on the Amazon Web Services Registry of Open Data and is designed from the ground up to be Analysis Ready. The data archive includes nighttime lights imagery for DMSP-OLS and VIIRS-DNB and supplemental data quality layers for creating masks against cloud coverage, lunar illuminance and stray light, among other artifacts. More details are available on the technical documentation page.
This launch represents years of work to make this archive available publicly, and is the start of more resources involving the access and analysis of these data. One of those resources is the World Bank Open Nighttime Lights tutorial, developed by Daynan Crull and with support from Dr. Kim Baugh of NOAA, Prof. Brian Min from the University of Michigan and NLT’s Chief Scientist, Ran Goldblatt.
NLT has long been an advocate of open data and the power of remote sensing to drive research. We recognize; however, that just because datasets are open for use publicly does not mean there is no cost in terms of the time and expertise needed to convert these data into meaningful information, which is not always available to everyone. This can be particularly true in developing countries or immediately following disasters where such data can yield critical information.
We developed the World Bank Open Nighttime Lights tutorial for this project as a hands-on way to reduce these barriers and demystify nighttime lights data for people who may think using them requires specialty experience (they do not). The tutorial contains some fundamental concepts for accessing open satellite data and is aimed at a broad audience with the objective to put these data, and the power of their insights, in the hands of as many practitioners as possible.

Screenshot from a tutorial to show how to make an interactive map using VIIRS-DNB data.
In addition to the fundamentals for accessing and visualizing these data, there are modules dedicated to understanding how to clean the data for analysis, create plots, execute conditional operations and band math, do some simple compositing, get zonal statistics, and do time series and comparative analysis.
In December 2020 we hosted a day-long workshop with this tutorial as part of the 3rd Annual Geo4Dev Symposium and Workshop. We hope that this tutorial and the many excellent presentations delivered that week (available here), along with the World Bank’s “Light Every Night” data archive, will have an immediate impact around the world.
We are also engaged in a variety of advanced research projects and applications using data science and machine learning that can help us better understand our world, solve problems, and drive missions forward for our clients and partners. Read more about how we’re doing this here. There is more to come as we develop tools and resources so that nighttime lights analysis can inspire and instruct an ever-growing community of analysts, researchers, and curious minds.
This project (and data) made possible by the World Bank Trust Fund for Statistical Capacity Building (TFSCB)
New Light Technologies, Inc. (NLT) is a leading provider of integrated information technology, technical, scientific, consulting, and research services based in Washington, DC. NLT provides a broad range of integrated cloud, agile software development, cybersecurity, data science, geospatial, and workforce services and ready-to-use solutions for customers and offers distinctive capabilities in developing secure cloud-native AI/ML data analytics and decision support tools. The firm also provides unique expertise in developing, implementing, and managing enterprise solutions that enable the collection, integration, modeling and analysis, privacy protection, quality control, visualization, and public release of large-scale datasets and web-based data dissemination platforms. Contact us for more information and set up a conversation with our team members while you are at a conference, or get on our chatbot, and we’ll be on standby to get you connected with our team. Visit https://newlighttechnologies.com/.
Discover the profound impact of Nighttime Light Emission on urban life and well-being.
Explore the evolution of nighttime light imaging satellites over fifty years, from DMSP to VIIRS, and their impact on scientific fields.
Explore how nighttime lights are revolutionizing our understanding of human activity on Earth, particularly during events like the COVID-19 pandemic.